Thursday, March 12, 2015

Summitville and Berkeley Mine


Summitville Mine
The Summitville Mine is an open pit site is found 25 miles south of Del Norte, Colorado with an elevation of 11,500 feet above sea level in southwestern Colorado. The mine site is located south of Wightman Fork, about two miles east of the Continental Divide. The town of Summitville is just to the north of the mine site on the other side of Wightman Fork (EPA) . 

The region is usually subject to severe winters with substantial snowfall that gather on steep slopes. Snow may usually remain on the ground until late spring or early summer. It provides water in sizes sufficient to keep streams flowing year-round, and the snow acts as a continual source of water entering the soil.

Gold and silver mining started at Summitville around 1870. Large scale, open-pit mining started at the site in 1984. The mine operator was Summitville Consolidated Mining Corp., Inc. They used cyanide heap leaching to extract metals from the ore. In this process, the ore mined from the mountain was crushed and placed onto the clay and synthetic-lined heap leach pad. Sodium cyanide solutions were then applied to leach out gold and silver.

Almost immediately after its construction in 1986, there was a leak detected in the heap leach pad. Summitville Consolidated Mining Corp abandoned the site and announced that they were filing for bankruptcy in December 1992 (SUMMITVILLE MINE DISASTER). The EPA immediately presumed responsibility of the site as an act of emergency response. On May 31, 1994 Summitville was put on the National Priorities List of Superfund sites (EPA).


Copper, cadmium, manganese, zinc, lead, nickel, aluminum, and iron have contaminated the surface water, groundwater and the soil.Mining operations deforested and greatly disturbed most of the land area at the site. Because of the site has so many minerals, almost all exposed natural materials are capable of generating acid. The acid moves the variety of metals that are then discharged and as a result contaminate the Alamosa River system which is right below the site.  Because of this, surface water quality downstream of the mine has been degraded by low pH water and also by raised levels of dissolved solids and heavy metals, mainly copper (SUMMITVILLE MINE DISASTER)


In 1997, according to the Agency for Toxic Substances and Disease Registry a public health assessment led to the classification of the Summitville site as having no apparent public health hazard. However, ecological impacts from site contaminants have been significant (THE SUMMITVILLE MINE AND ITS DOWNSTREAM EFFECTS). The Alamosa River system below the site cannot currently support aquatic life. Studies show that that there are negative effects to agriculture and livestock from regular use of Alamosa River water.


Berkeley Pit Mine


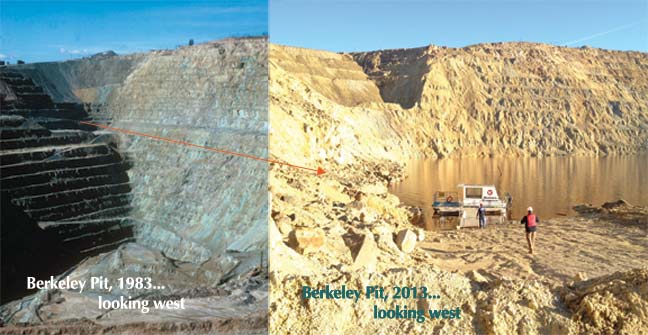
The Berkeley Pit was a former open pit copper mine located in Butte, Montana, United States. It is a mile long by half a mile wide with a depth of about 1,780 feet. It is filled to about 900 feet with water that is heavily acidic. It has  a 2.5 pH level and as a result, the pit is overloaded with heavy metals and dangerous chemicals that leach from the rock, including copper, arsenic, cadmium, zinc, and sulfuric acid.


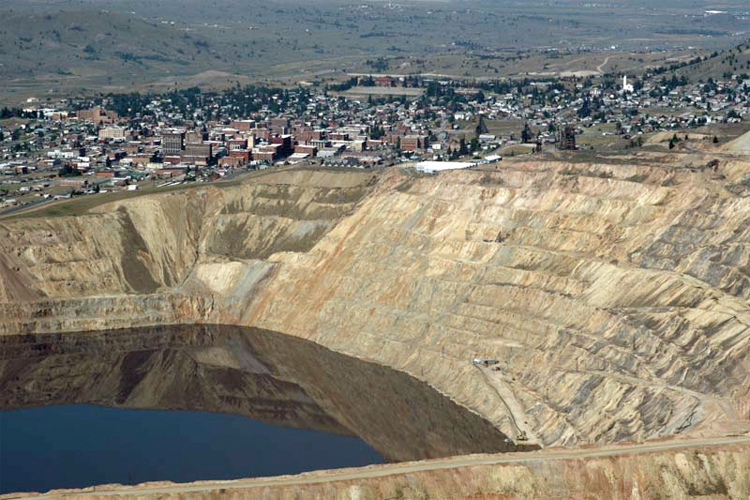
Approximately 320 million tons of ore and over 700 million tons of waste rock were mined from the Butte Hill (Pitwatch). The Berkeley Mine, located in Butte, Montana is an open pit copper mine. This means that it has the same basic shape as the Summitville mine, an inverted mountain, but instead of mining for gold, this mine is meant for copper. Copper is an extremely important metal in modern society because it is the means for all the modern technology. This is because all wires that are used for electronics use copper to conduct electricity. More important than this use is copper in generators. The generators that spin because of some kinetic force are able to convert the energy to electricity using copper wire spinning around magnetic force, allowing electrons to flow.  The pit is one mile long by half a mile wide with an approximate depth of 1,780 feet (540 m). It is filled to a depth of about 900 feet (270 m) with water that is heavily acidic (2.5 pH level), about the acidity of cola or lemon juice. This acidity is obviously extremely dangerous to life around the mine. Copper sulfate was extracted from the mines in order to make copper. 

As NASA states, "The mine took advantage of the existing subterranean drainage and pump network to lower groundwater until 1982, when a new owner suspended operations. After the pumps were turned off, water from the surrounding rock basin began seeping into the pit. By the time an astronaut on the International Space Station took this picture on August 2, 2006, water in the pit was more than 275 meters (900 feet) deep." The acidity of the liquid in the pit is so great that it is eating away at the rock and spreading the acidic water around to surrounding surface water, groundwater, and soil. Ultimately, about 1,000,000,000 tons of material was mined from the Berkeley Pit. The acidity is so great, that in 1995, a flock of geese landed in the Berkeley pit water, and all 342 geese died. After closer inspection by scientists, it was revealed that the insides of the geese were lined with burns and festering sores from exposure to high concentrations of copper, cadmium, and arsenic, obviously linking the pit to the death of the geese. 
To clean up the pit, a treatment plant has started construction to treat the water in the pit and the tailings pond. The treatment plant should be done and will be ready to treat the water and remove the toxins and acidity of the water in 2018.

Both of these mines are on the federal EPA Superfund site list. According to the EPA, "A Superfund site is an uncontrolled or abandoned place where hazardous waste is located, possibly affecting local ecosystems or people." The EPA helps analyze and protect the areas that have been identified as Superfund sites and help to resolve the issues that the problem presents to the environment. The Summitville mine is on the National Priorities List, and as of now, the EPA has listed their work as a success, with current human exposures at the site under control and contaminated ground water migration is under control.

Work Cited
 Costanzi, Fran. "EPA." Summitville Mine. EPA, 8 Jan. 2015. Web. 12 Mar. 2015.
EPA. Superfund Process. Digital image. San Jacinto River Waste Community Involvement. EPA, 31 July 2014. Web. 12 Mar. 2015.
EPA. "Superfund Sites Where You Live." EPA. Environmental Protection Agency, 19 Feb. 2014. Web. 10 Mar. 2015.
Mining-technology.com. Open Pit Mine Planning. Digital image. Marston - Mining Engineers and Consultants. Mining-technology.com, 2015. Web. 12 Mar. 2015.
NASA. Berkeley Pit Mine. Digital image. Image of the Day Gallery. NASA, 23 Mar. 2008. Web. 12 Mar. 2015.
Plumlee, Geoffrey S. "THE SUMMITVILLE MINE AND ITS DOWNSTREAM EFFECTS." Ate THE SUMMITVILLE MINE AND ITS DOWNSTREAM EFFECTS. Usgs, 01 Jan. 1995. Web. 11 Mar. 2015.
Williams, Mark. Aerial View of Summitville Mine. Digital image. Landscapes and Water. University of Colorado Boulder, 1995. Web. 12 Mar. 2015.
William, Mar. "Toxic Waste Cleanup." Landscapes and Water (GEOG 1011): Summitville Mine Disaster. Mark Williams, 1 Jan. 1995. Web. 11 Mar. 2015.


Monday, December 8, 2014

Biodiversity Hotspots: Southwest Australia


The Southwest Australia Hotspot takes over an area of around 356,717 km squared around the southwestern ed of Australia. This hotspot is one of the 5 Mediterranean type ecosystems in the world. The summers in this area are usually dry while the winter months are characterized by rain. Further inland, rainfall decreases even more and the length of rain seasons decrease.


Southwest Australia is attributed to millions of years of isolation from the rest of Australia by the country's central deserts. Extreme climate shifts and poor soils also promoted specialization of the region's flora. Out of more than 5,570 species of vascular plants found in this hotspot, nearly 2,950 are endemic, making up about 53 percent. A significant number of genera at this hotspot are also endemic as 12.5 percent are found nowhere else in the world. 
Over 280 native bird species occupy the region, 12 of which are endemic. The level of endemism is slightly higher than in other Mediterranean-type hotspots, and the region is considered an Endemic Bird Area.
The region is home to 22 parrot species; three endemics, including Carnaby's black-cockatoo, the noisy scrub-bird, which earned its name through the loud vocalizations of its males, which was presumed extinct until a small population was rediscovered in 1961. Several other bird species are near threatened or rapidly declining in the face of habitat loss, modification and fragmentation and inappropriate fires.
The greatest human impact in Southwest Australia has been the clearing of native vegetation for agriculture. Agricultural development began in 1829, with the arrival of the first European settlers, but because of the poor soils, development progressed slowly until the 1890s, when phosphate fertilizers were introduced. Today, most usable private land in this area is farmed, although it requires the application of phosphate, with zinc, copper, cobalt, and molybdenum. Because of the region's long dry seasons, bush fires have traditionally been used for hunting and clearing land. Even though native plants are highly adapted to fire, the alteration or intensification of fires can dramatically change the composition and condition of the natural vegetation.
There are a number of conservation programs and projects currently operating in Southwest Australia. The Western Shield Program, run by the Department of Conservation and Land Management, is working to bring at least 13 native fauna species back from the brink of extinction by controlling introduced predators, such as the fox and feral cat. The Eden Project project uses innovative techniques to eradicate feral herbivores and predators and rejuvenate 105,000 hectares of arid zone habitation Peron Peninsula at Shark Bay for threatened native fauna, and, to promote their reintroduction into the area (Conservation International).
Work Cited

Caley, Kevin J., ed. “Biological diversity in Southwest Australia.” The Encyclopedia of Earth. N.p., 22 Aug. 2008. Web. 8 Dec. 2014. <http://www.eoearth.org/view/article/150629/>.

Tuesday, September 30, 2014

Learning About Food Webs and Energy Pyramids Summary

In order for one to understand what a food web is, he or she must first know what a food chain is. A food chain shows the movement of energy and nutrients from one organism to another when the first organism is eaten by the second, who's in turn eaten by a third and so on (Environmental Issues and Solutions Module Curriculum Guide). And so the type of food that each organism in a food chain eats determine its Trophic level. Therefore Trophic levels or feeding levels include a producer, a primary consumer, a secondary consumer, a tertiary consumer, and a decomposer. This is the order whereby organisms feed in a food chain: Producers produce their own food, then primary consumers eat the producers. The primary consumers are then eaten by a secondary consumer who is later eaten by a tertiary consumer. Producers are also known as an autotrophs because they are self feeders, meaning that they make their own food while all consumers who can't produce their own food are heterotrophs because they eat autotrophs or other heterotrophs (Environmental Issues and Solutions Module Curriculum Guide). Within food chains exist Energy Pyramids which tell us that at every Trophic level to which energy is transferred, 90 percent of the energy being transferred is lost. This means that when a primary consumer eats a producer, they only acquire 10 percent of the producer's energy, and when a secondary consumer eats a primary consumer, only 10 percent of the energy is acquired. So, a food web is a network of interconnected food chains.
The biome for my food web is the ocean because all the creatures in the food web reside in the ocean. The first food chain consists of a marine fungi, a tiger shark, a lantern fish, an oysters and a sargassum. And so this is a food web because it consists of a network of interconnected food chains. In this case, the sargassum is the autotroph/producer because it produces its own food then the oysters, being the primary consumer eats the sargassum. As a result, the lantern fish(secondary consumer) eats the oyster, then the tiger shark(tertiary consumer) eats the lantern fish. Lastly, when the tiger shark dies, the marine fungi decomposes its remains. This is a food web because these food chains in the picture are interconnected meaning that a primary consumer from one food chain like the sea turtle man consume a sargassum instead of the producer in its food chain.


Work Cited
Frey Scientific. Environmental Issues and Solutions Module Curriculum Guide. Nashua, New Hampshire: Frey Scientific, 2013. Print

Sunday, September 7, 2014

Ecological Footprint Summary

Ecological Footprint is known as the measure of how much area of biologically productive land and water an individual, population or activity requires to produce all the resources it consumes and to absorb the waste it generates (Glossary). In other words, the Ecological Footprint of a population, person or activity measures the demand it has on nature and in accordance, how much unharvested, pure land is needed to regenerate the resources we use. This measurement exists because through our daily activities, humans consume resources and in return produce waste, so the Ecological Footprint basically tells us whether the earth/nature can keep up with our waste.

Extra Credit:
According to the trends on the Ecological Footprint site, in 2010, Brazil had an Ecological Footprint of approximately 0.5 Global Hectares per person in comparison to its biocapacity of approximately 10 Global Hectares per person which means that in 2010, Brazil had less impact on the earth that its environment permitted. This could be a result of great amount of arable land in Brazil, or the people's environmental awareness.  Japan on the other hand, had an Ecological Footprint of approximately 4.2 Global Hectares per person with a biocapacity of about 0.5 Global Hectares per person which means that every Japanese wasted about 3.7 Global Hectares worth of unrecoverable resources according to their country's capacity unlike Brazil which wasted much less resources than its arable land was capable or regenerating (Trends). This difference in Japan's Ecological Footprint and biocapacity could be due to the lack of arable land to keep up with possible increased industrial activities.


Works Cited
"Glossary." Global Footprint Network. Global Footprint Network, n.d. Web. 7 Sept. 2014. <http://www.footprintnetwork.org/en/index.php/GFN/page/glossary/>.

"Trends." Global Footprint Network. Global Footprint Network, n.d. Web. 7 Sept. 2014. <http://www.footprintnetwork.org/en/index.php/GFN/page/trends/>.